Download Your Amazon Transaction Report
To calculate your Amazon store's true profit and loss, you need one specific financial file from Seller Central. This guide shows you exactly where to go, what to select, and how to download it.
📋 Download the Report in 4 Simple Steps
Open Amazon Seller Central in a browser and follow these steps exactly as shown in the screenshots.
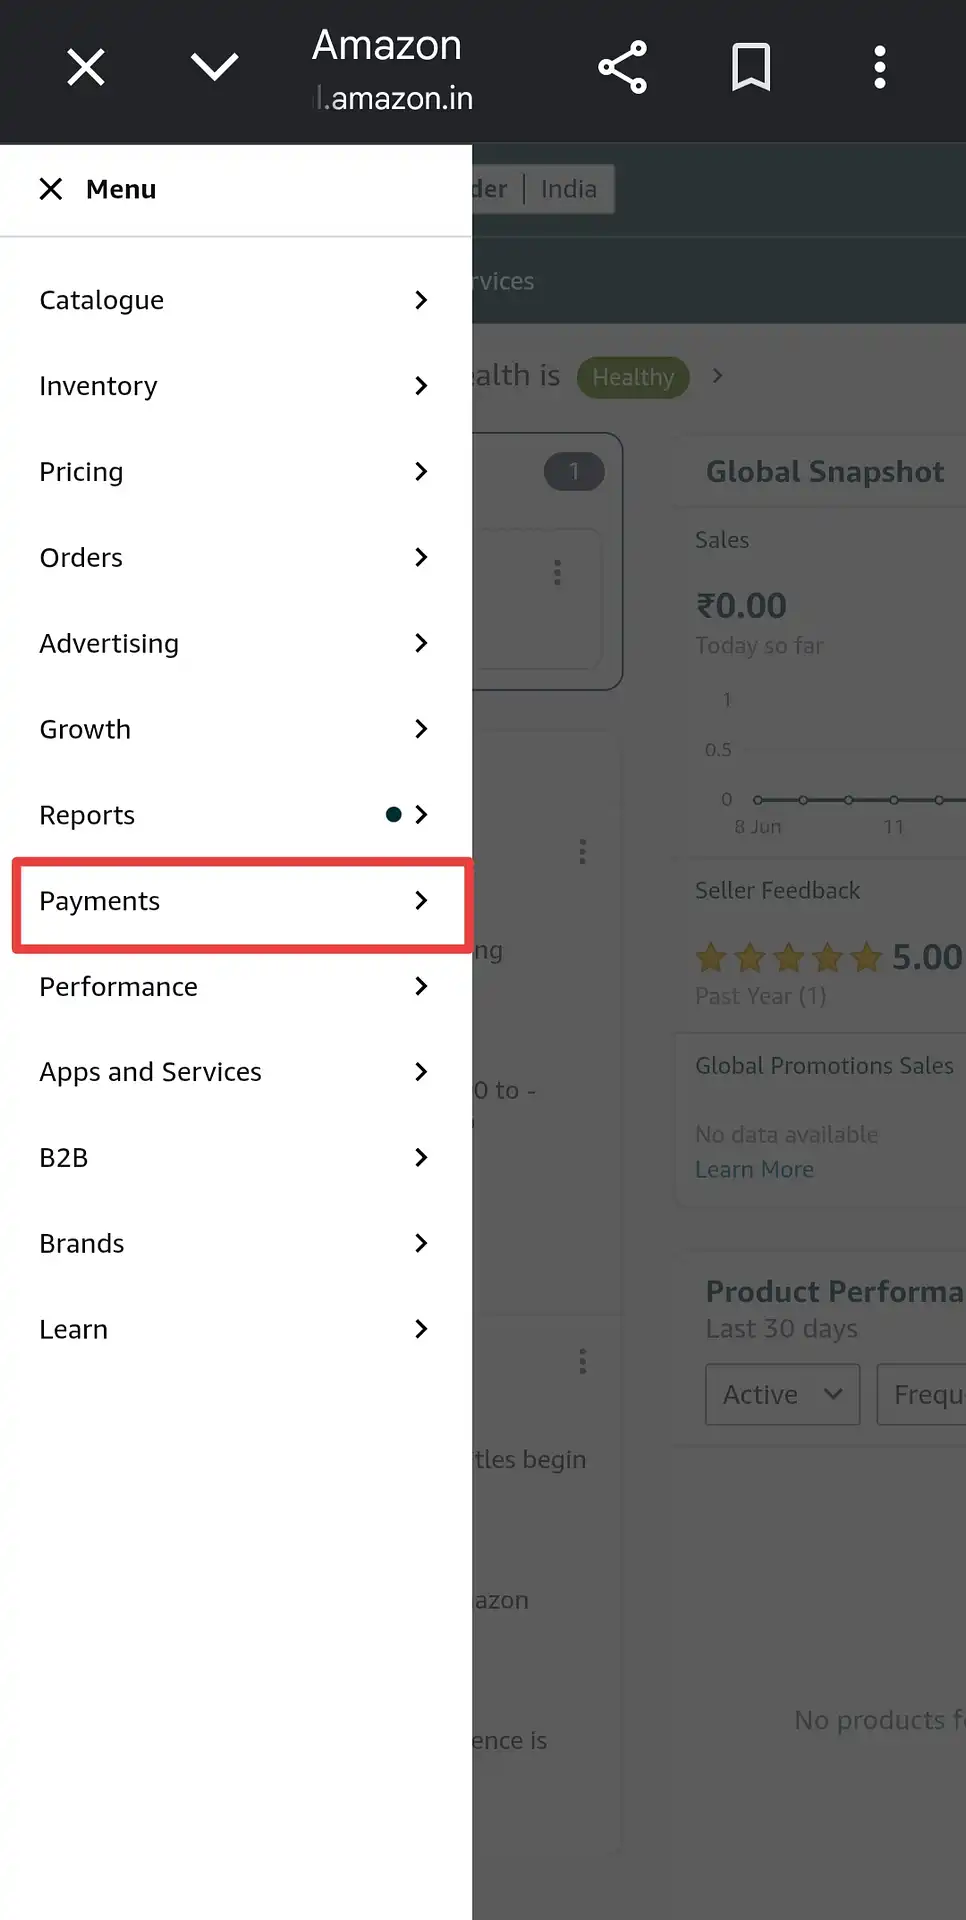
Open the Menu and Tap "Payments"
Log in to Amazon Seller Central. Tap the Menu icon (☰) at the top-left to open the navigation sidebar. Scroll down and tap on "Payments" — you'll see an arrow indicating it has a sub-menu.
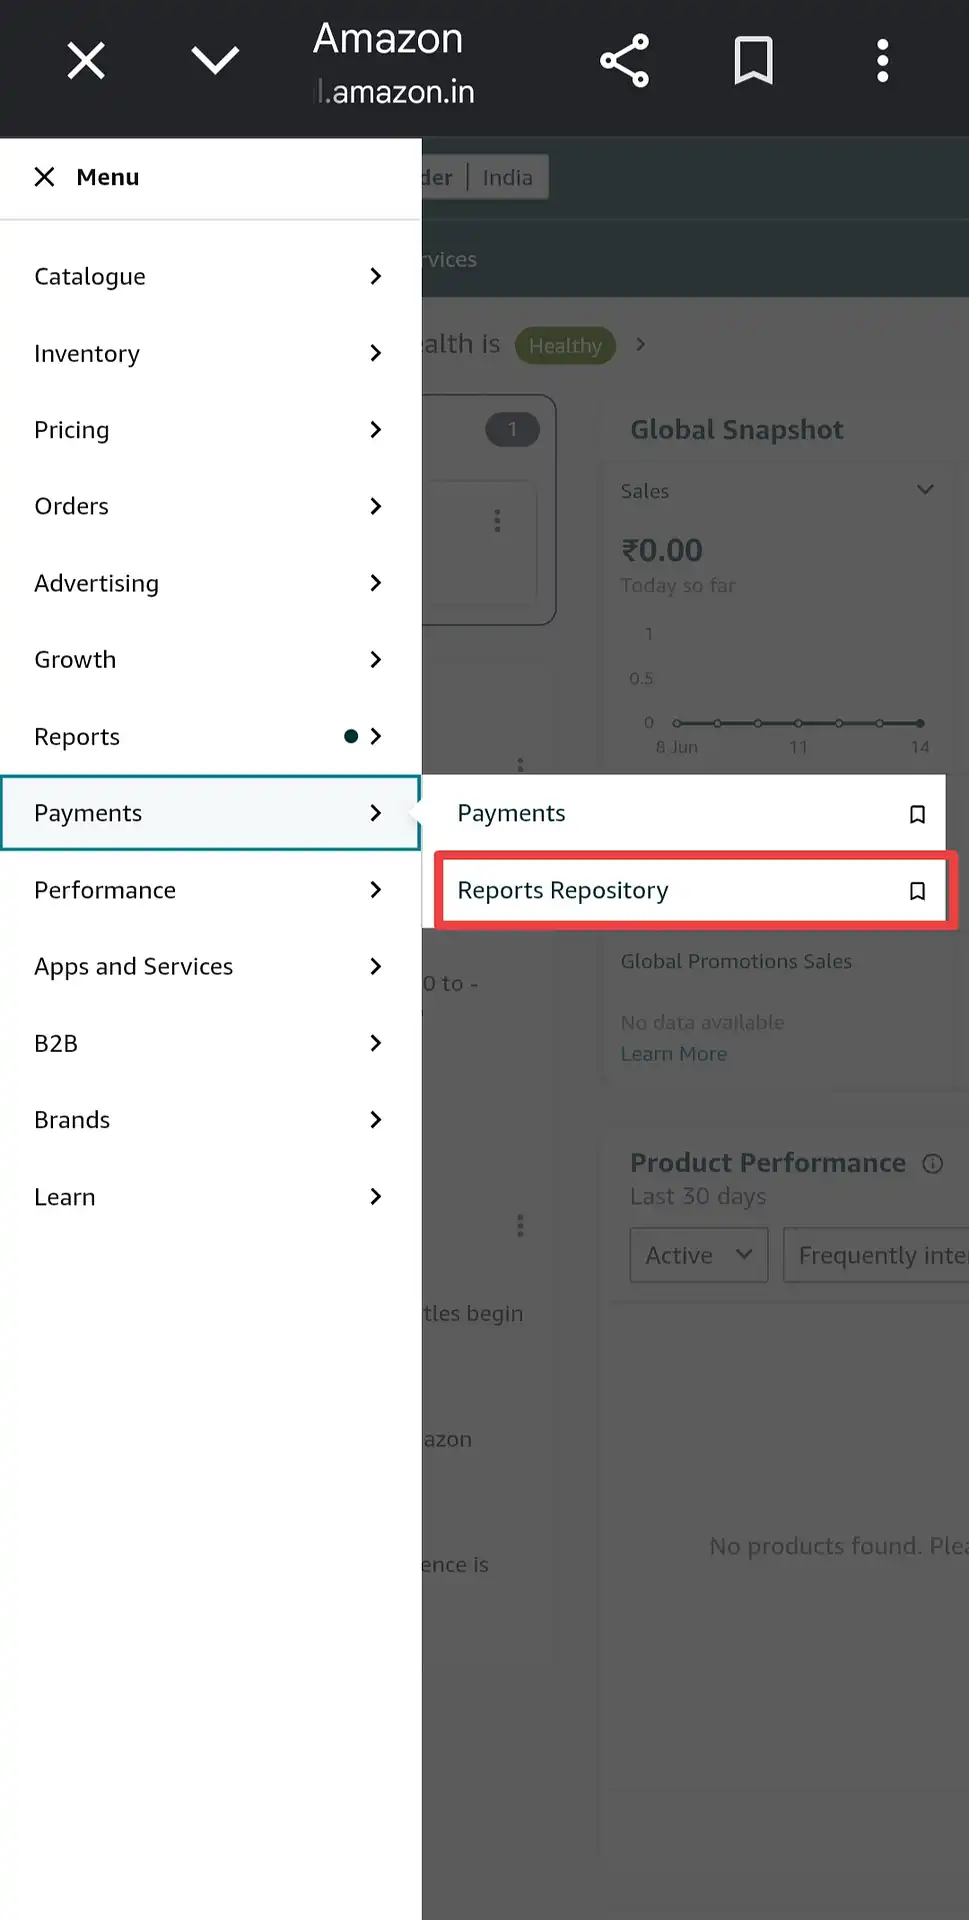
Select "Reports Repository"
After tapping Payments, a sub-menu slides out on the right. Tap on "Reports Repository". This is where Amazon stores all your historical financial reports — do not tap "Payments" (the top option), go directly to Reports Repository.
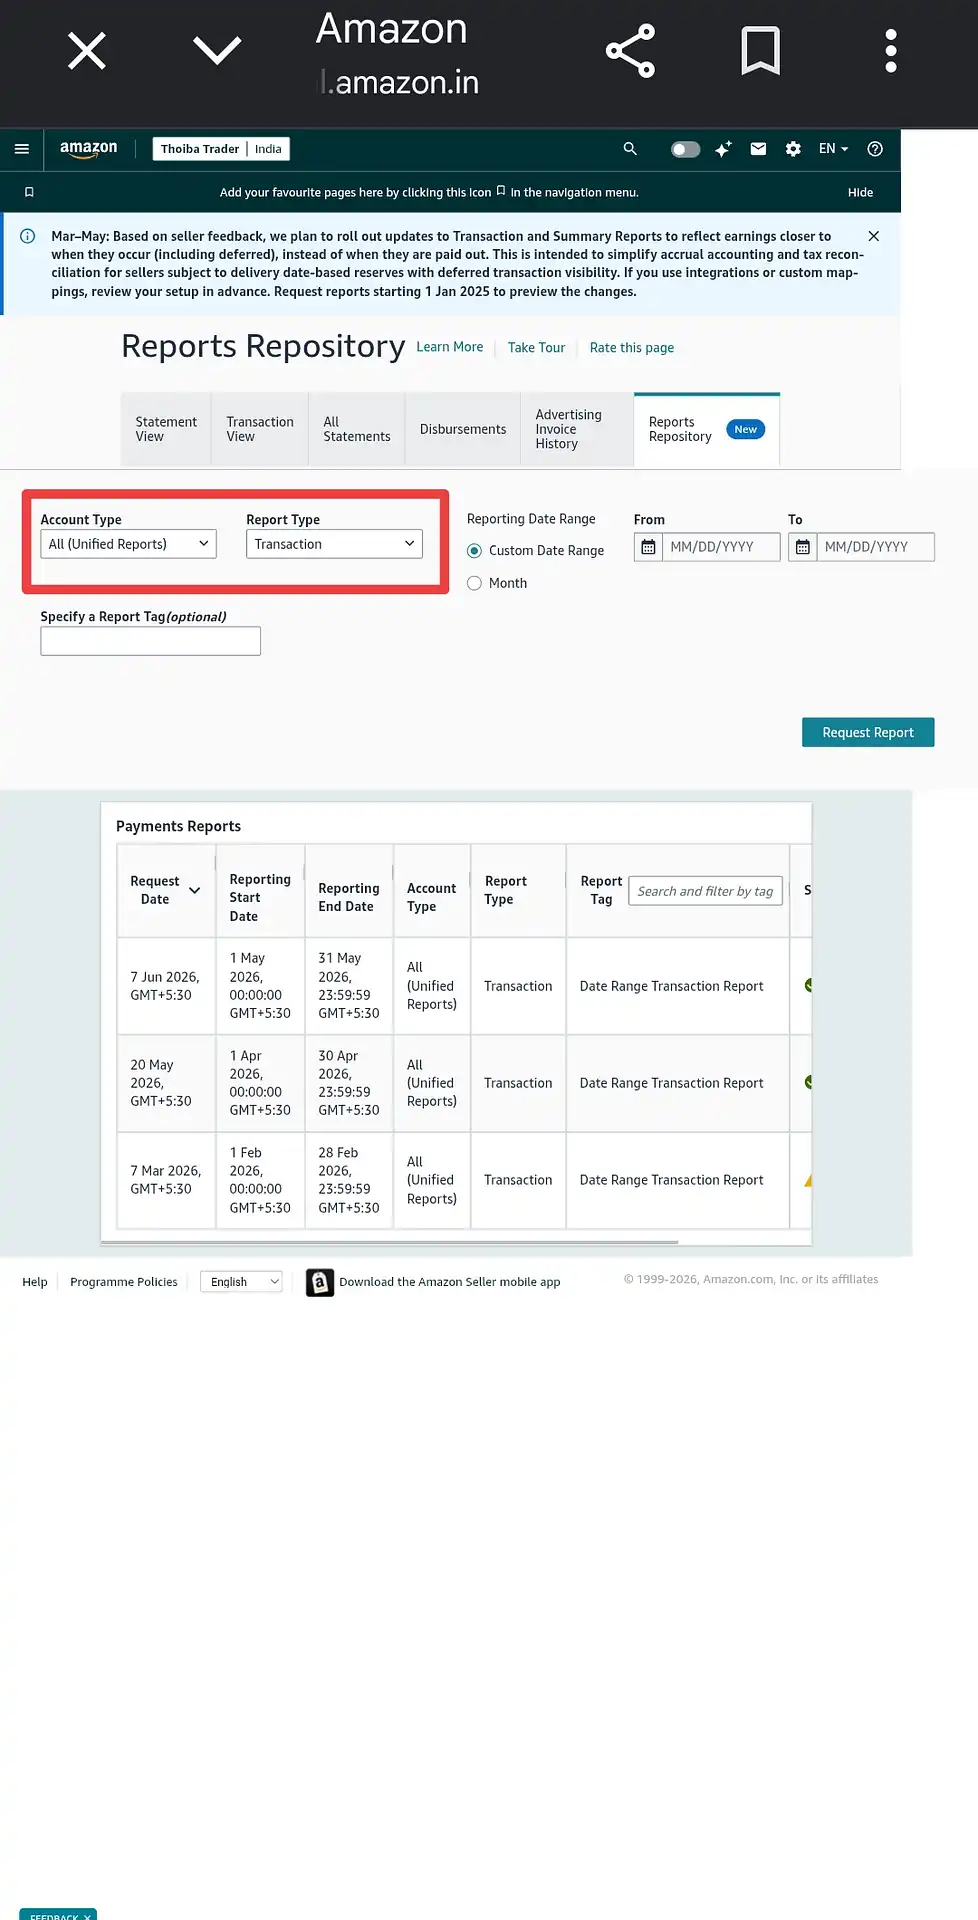
Select Your Date Range
The Reports Repository page opens with the correct settings already in place by default — Account Type is pre-set to "All (Unified Reports)" and Report Type is pre-set to "Transaction". You don't need to change either of these.
The only thing you need to do is select Custom Date Range and enter your From and To dates for the period you want to analyse.
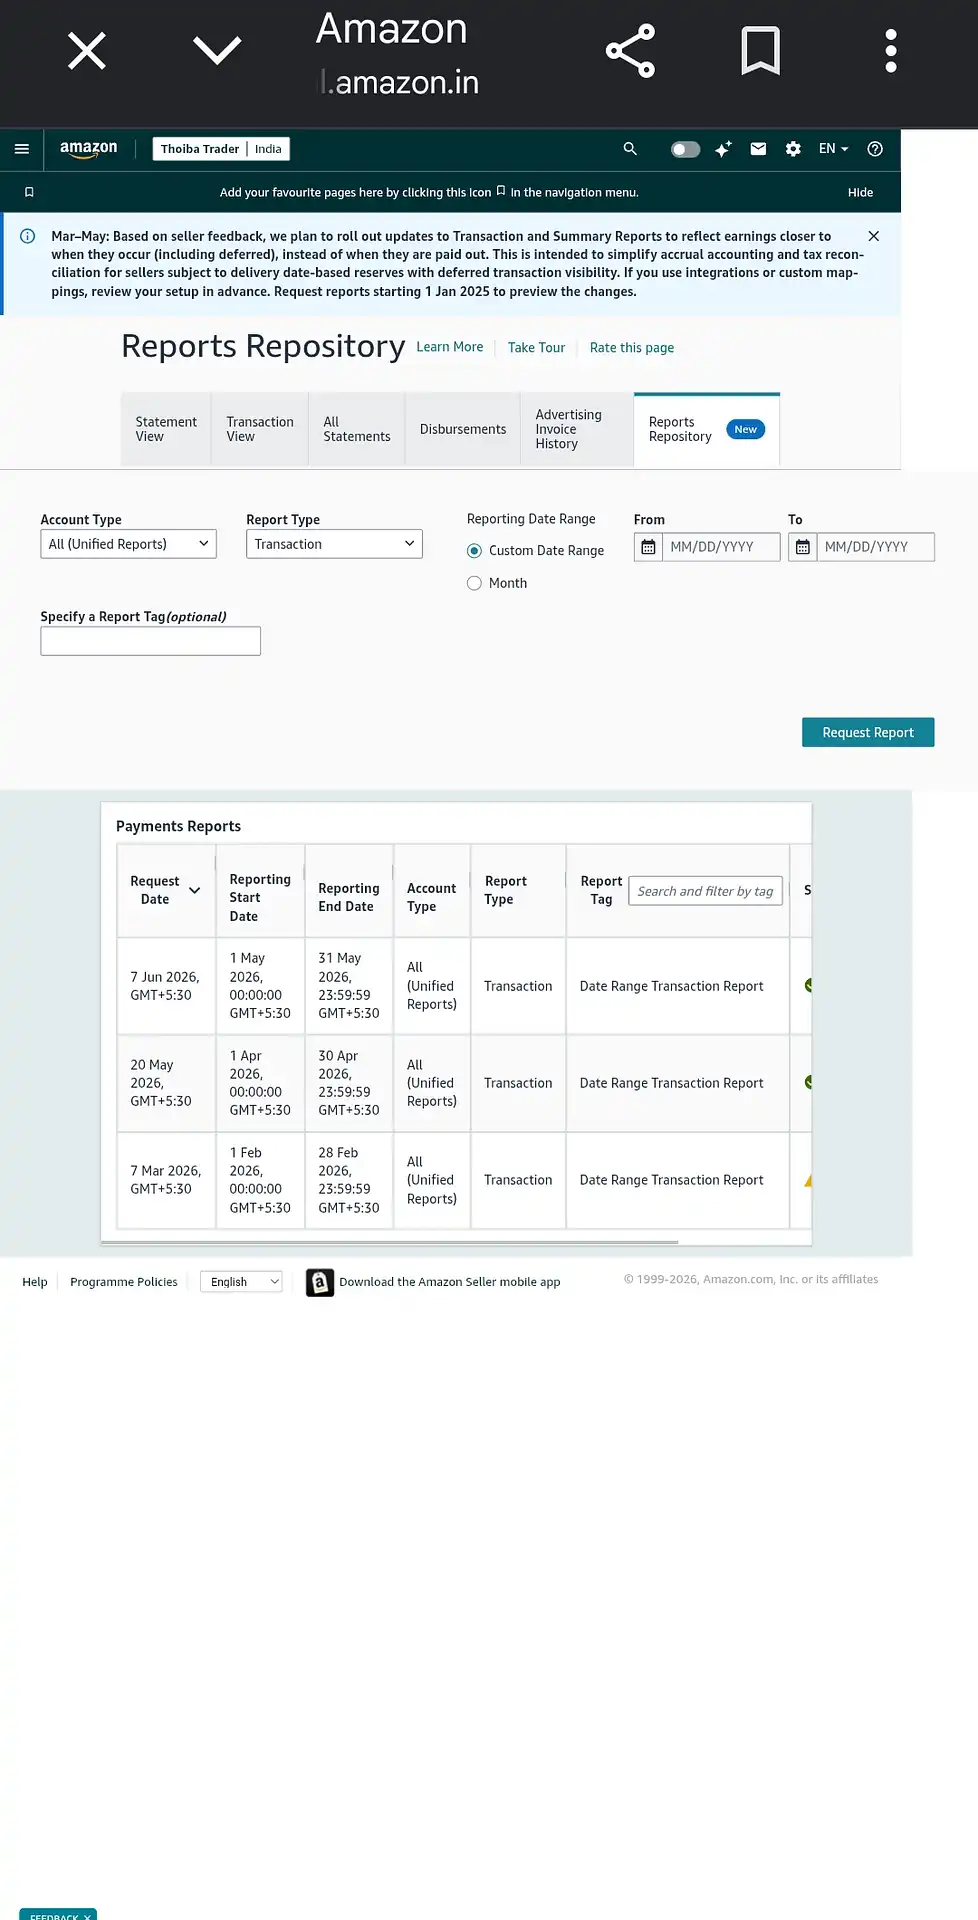
Request the Report and Download
Click the "Request Report" button on the right. Amazon will process your request — this usually takes a few seconds to a minute. Once the status in the Payments Reports table below changes to a green download icon, click it to save the file. The report will download as a .csv file named "Date Range Transaction Report".
What Does This Report Contain?
The "Date Range Transaction Report" is a .csv file that contains a line-by-line record of every financial event on your Amazon account within the selected date range. Each row represents one transaction — an order payment, a refund, a commission fee, an FBA fulfilment charge, or any other adjustment Amazon has applied to your account.
The file includes columns for transaction type, order ID, SKU, settlement amount, and payment status — which tells the calculator exactly how much money was credited or debited for every order in the period.
What Does Our Calculator Do With This File?
When you upload the Amazon transaction file, the calculator reads each row and identifies which transactions are order payments (delivered revenue) and which are refunds or returns. It then links each transaction to your product list by SKU and calculates your net settlement amount per order — how much Amazon actually paid you after deducting all their charges.
Once you enter your cost price (COGS) and packaging cost per SKU, the calculator instantly shows you which products are generating profit, which are running at a loss, and your overall net P&L for the selected period — alongside your Meesho or Flipkart data if you've uploaded those as well.
Why .csv and Not .xlsx?
Amazon exports this particular report in .csv (comma-separated values) format — this is Amazon's standard format for transaction-level data. Our calculator is built to accept the Amazon file in .csv format. Do not convert it to .xlsx before uploading — upload the file exactly as downloaded.
What Date Range Should I Select?
Select the period you want to analyse — for example, a specific calendar month. A wider date range means a larger file, but the calculator handles it without issues. For the most accurate monthly P&L, we recommend requesting the report month by month rather than for very long periods at once.
Frequently Asked Questions
The Transaction report gives a row-by-row breakdown of every financial event — order payments, refunds, and fees — at the individual order level. Other report types like Summary or Disbursement only show totals and do not contain the per-order data our calculator needs to compute SKU-wise profitability.
Reports Repository is under the Payments menu — not the Reports menu. Open the main Menu (☰), tap Payments, and then tap Reports Repository from the sub-menu that appears. If you're on mobile, it helps to switch to desktop mode in your browser.
Yes, this is normal. Amazon processes the report on their servers after you click Request Report. Depending on the date range and server load, it can take anywhere from a few seconds to a couple of minutes. Refresh the page and check the Payments Reports table — once the status turns to a download icon, the file is ready.
Yes, the calculator can handle larger files. However, for the clearest month-by-month picture of your business, we recommend downloading and analysing one month at a time. You can always request multiple reports from your history — previously generated reports remain available in the Payments Reports table.
Completely. The file is processed entirely within your browser using local computation — at no point is the file transmitted to or stored on any server. Your transaction data remains on your device throughout the entire process.
Yes — just upload all three files at once. The calculator accepts your Amazon .csv alongside your Meesho .xlsx and Flipkart .xlsx files, and generates both a unified cross-platform P&L summary and separate breakdowns for each marketplace in a single report.